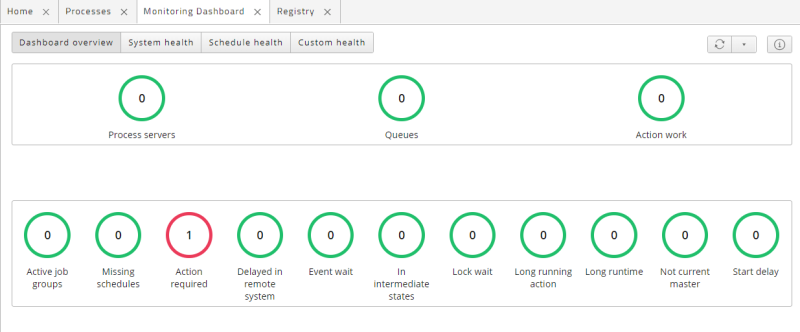
Monitoring Dashboard
The Monitoring Dashboard displays real-time information on system health for Process Definitions, Secure Gateways, action work (for example, work performed for process actions, triggers, and Time Window calculations), and a number of Process Servers and Queues. It includes the following tabs:
- Dashboard overview: Displays all monitors.
- System health: Displays Process servers, Queues, and Action work monitors.
- Schedule Health: Displays all process-related monitors.
Note: For information on customizing the Monitoring Dashboard, see Customizing the Monitoring Dashboard.
System Health
System health monitors display the status of Process Servers, Queues, and action work.
Note: To control which Process Servers and Queues are monitored, use the Monitor On Dashboard property.
- A Queue that is either held or closed (not served by any running Process Servers) counts towards the total number of action items.
- A Process Server that is shut down counts towards the total number of action items.
- Action work is counted in terms of concurrent action workers. By default, 50 to 74 concurrent action workers will cause this monitor to turn orange, and 75 or more will cause it to turn red.
Schedule Health
Schedule health monitors display problematic processes.
Note: To view in-depth documentation for each of these monitors, navigate to Definitions > Documents and search for DashboardHelp.
- Active job groups: Active process schedules without currently scheduled processes
- Missing schedules: Process groups that have a specific number of processes that missed their schedule (default 1).
- Action required: Processes that have been in a state requiring manual intervention for a specific duration (default 1 day).
- Delayed in remote system: Processes that have been delayed in a remote system for a specific duration (default 1 minute).
- Event wait: Processes that have been in EventWait status for a specific duration (default 7 days).
- In intermediate states: Processes that have been in intermediate states for a specific duration (default 20 seconds).
- Lock wait: Processes that have been in LockWait status for a specific duration (default 1 hour).
- Long running action: Processes that have been subject to long running actions or triggers (default 1 minute).
- Long runtime: Processes that have been running for specific duration (default 1 day).
- Not current master: Processes that are not using the latest version of their Process Definitions.
- Start delay: Processes that have seen their start delayed by a specific duration (default 20 seconds).
System Health Configuration
| Monitor | Default |
|---|---|
| Action work | Red=75, Orange=50 |
Schedule Health Configuration
| Monitor | Default | Range |
|---|---|---|
| Active job groups | 1 | Min: 1 Max: 1000 |
| Missing schedules | 1 | Min: 1 Max: 1000 |
| Not current master | 1 | Min: 1 Max: 1000 |
| Action required | 1d | Min: 1h Max: 30d |
| Delayed in remote system | 60s | Min: 1s Max: 1d |
| Event wait | 7d | Min: 1h Max: 30d |
| Intermediate states | 20s | Min: 1s Max: 1d |
| Lock wait | 1h | Min: 1s Max: 1d |
| Long running action | 60s | Min: 1s Max: 1d |
| Long runtime | 1d | Min: 1h Max: 30d |
| Start delay | 20s | Min: 1s Max: 1d |
Custom Monitors
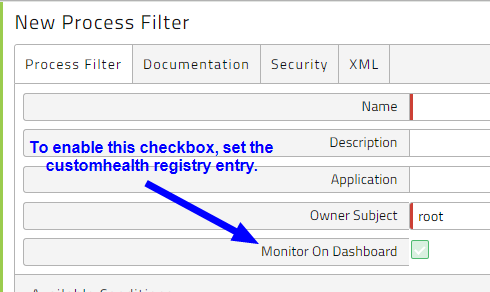
You can add your own monitors to the Monitoring Dashboard. Before you do so, though, you must enable the Custom Health feature.
Enabling Custom Health
To enable the Custom Health feature, add or edit the /configuration/jcs/monitoringdashboard/customhealth/enabled registry entry and set its value to true. Once you have done so, the Monitor On Dashboard check box becomes available for filters.
When the Custom Health feature is enabled, the Custom health button displays in the Monitoring Dashboard.
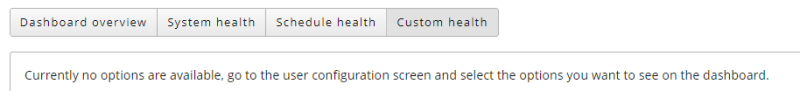
Adding Monitors to the Custom Health Dashboard
To add a custom monitor to the Monitoring Dashboard:
-
Make sure the
/configuration/jcs/monitoringdashboard/customhealth/enabledregistry entry is set totrue(see above). -
Navigate to an overview (for example Monitoring > Processes or Monitoring > Events).
-
Right-click in the list and choose Filter > New Filter from the context menu.
-
Enter a name.
-
Check Monitor on Dashboard. If you do not see this check box, make sure you set up the registry entry correctly.
-
Click Save & Close.
-
Navigate to Monitoring > Monitoring Dashboard. The new monitor does not display yet.
-
Click
 and choose User Configuration. The User Configuration screen displays.
 -
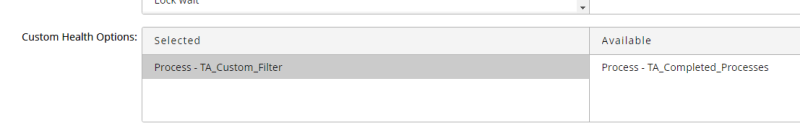
Scroll down to the Custom Health Options area and drag the new custom monitor from the Available side to the Selected side.
-
Click Save.
-
Click
again and choose Global Configuration. The Global Configuration screen displays. -
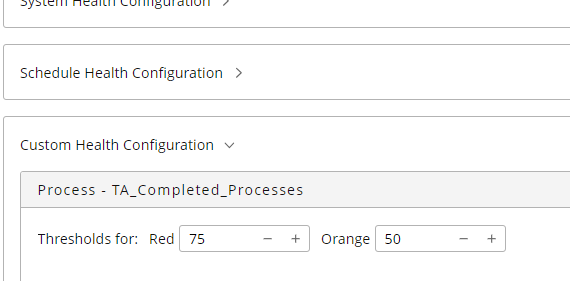
Expand the Custom Health Configuration area and set threshold values for Red and Orange. When the number of processes that matches the filter reaches the Orange value, the monitor will turn orange. If the number of processes that matches the filter reaches the Red value, the custom monitor will turn red.
-
Click Save.
-
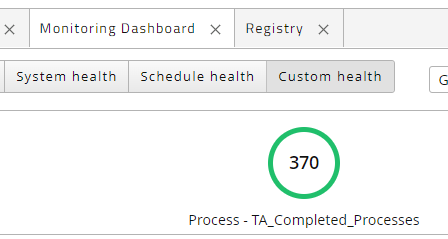
Click Custom health. Your custom monitor should display.
Custom Monitor Example
Assume you have a number of resource-intensive processes that need to run in a specific Queue. Because that Queue can handle only six concurrent processes, you would like to create a custom health monitor for it.
When creating the filter for this situation, you could:
- Select Where the process is in Queue, then click the blue Queue text and add the Queue.
- Select where the process has Status, choose Status in the detail pane, and select Running.