Customizing the Monitoring Dashboard
You can control various aspects of the monitors on the Monitoring Dashboard by clicking  at the upper right. This button lets you choose Global configuration, User configuration, or Help.
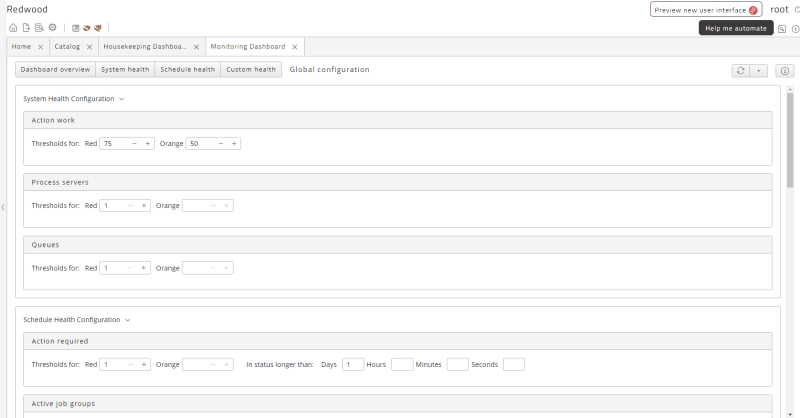
Global Configuration
The Global configuration screen lets you control the thresholds for the various graphs that make up the Monitoring Dashboard. In this screen, the graph configurations are grouped into System Health Configuration, Schedule Health Configuration, and Custom Health Configuration.
In these groups, you can set each graph's thresholds for turning Red and Orange. Some graphs let you further control their functionality by specifying how long a process has been in a given state.
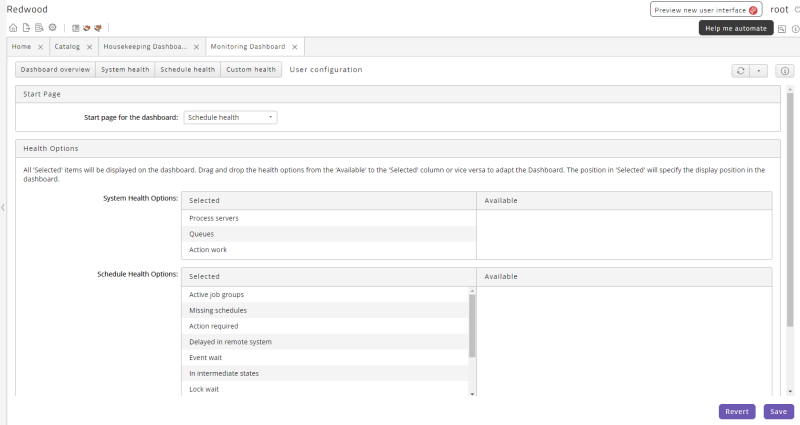
User Configuration
The User configuration screen lets you specify a start page for the Monitoring Dashboard.
This screen also lets you control which graphs display for you. You can drag and drop graphs between the Available and Selected columns.
Help
The Help option displays a help window.