Housekeeping Dashboard
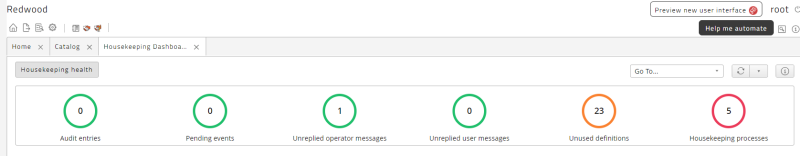
The Housekeeping Dashboard provides real-time information on housekeeping health. It lets you monitor audit entries, pending events, unused Process Definitions, unscheduled housekeeping processes, and Operator Messages and user messages that have not been responded to.
Note: For information on customizing the Monitoring Dashboard, see Customizing the Housekeeping Dashboard.
By default, the graphs displayed on the Housekeeping Dashboard are as follows.
-
Audit entries: A large number of audit entries can negatively impact performance.
-
Pending events: A large number of pending events can indicate a problem.
-
Unreplied operator messages: A large number of Operator Messages that have not yet been replied to can indicate a problem.
-
Unreplied user messages: A large number of user messages that have not yet been replied to can indicate a problem.
-
Unused definitions: A large number of unused Process Definitions or Chain Definitions can cause performance issues.
-
Housekeeping processes: Click this graph to see a list of system-level housekeeping Process Definitions.
Housekeeping Definition is Active Show on dashboard Frequency Range System_ArchiveAuditObjects truetrueDaily 1 Month System_ArchiveEvents truetrueDaily 1 Month System_DeleteJobFiles truetrueDaily 1 Month System_RemoveOldJobs falsetrueNone None System_RemoveOperatorMessages truetrueDaily 1 Month
Prerequisites
To use housekeeping dashboards, you must have the Housekeeping_Dashboard global privilege. This privilege is assigned to the scheduler-administrator or redwood-administrator role.
Custom Monitors
To add a custom monitor to the Monitoring Dashboard:
-
Make sure the
/configuration/jcs/monitoringdashboard/customhealth/enabledregistry entry is set totrue(see above). -
Navigate to an overview (for example Monitoring > Processes or Monitoring > Events).
-
Right-click in the list and choose Filter > New Filter from the context menu.
-
Enter a name.
-
Check Monitor on Dashboard. If you do not see this check box, make sure you set up the registry entry correctly.
-
Click Save & Close.
-
Navigate to Monitoring > Monitoring Dashboard. The new monitor does not display yet.
-
Click
 and choose User Configuration. The User Configuration screen displays.
 -
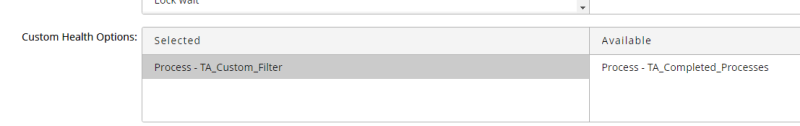
Scroll down to the Custom Health Options area and drag the new custom monitor from the Available side to the Selected side.
-
Click Save.
-
Click
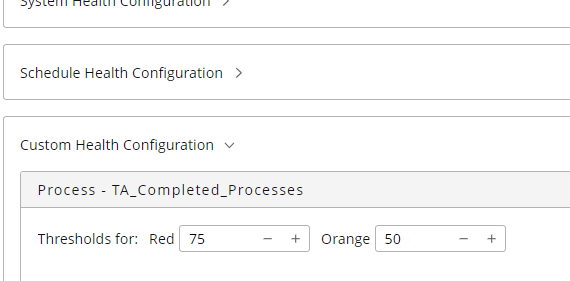
again and choose Global Configuration. The Global Configuration screen displays. -
Expand the Custom Health Configuration area and set threshold values for Red and Orange. When the number of processes that matches the filter reaches the Orange value, the monitor will turn orange. If the number of processes that matches the filter reaches the Red value, the custom monitor will turn red.
-
Click Save.
-
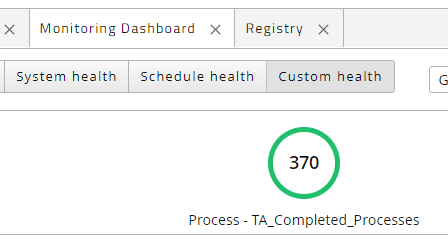
Click Custom health. Your custom monitor should display.
Documentation
Each item has its own configurable documentation stored in documents HousekeepingDashboardHelp_<item>.