The Monitor Tree
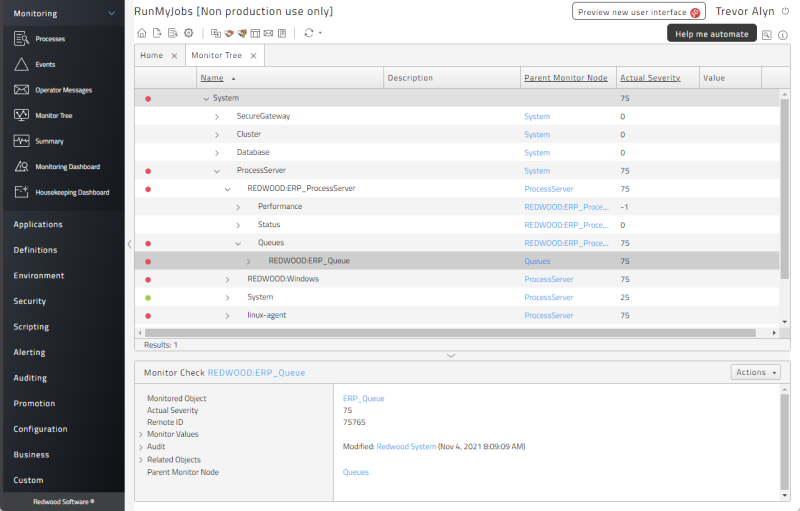
The Monitor Tree (Monitoring > Monitor Tree) provides a comprehensive hierarchical overview of RunMyJobs and lets you monitor potential issues. The severity of potential issues is indicated by a colored dot and by a value in the Actual Severity column. You can select any node in the tree to see more information about it in the Detail View.

Note: By default, only database tables are monitored. For information about other monitoring options, see Process Server and Queue Monitoring.
Severity
Severity is indicated by a number from 0-100, with lower numbers being less severe than higher numbers. Severity values are displayed in the Actual Severity column.
Severity can also be indicated by a dot in the first column:
-
No dot: Severity of 24 or less. Ideally, there should be no monitor nodes with a severity above 24.
-
Green dot: Severity beween 25 and 49.
-
Yellow dot: Severity between 50 and 74.
-
Red dot: Severity of 75 or greater.
Severity values propagate upward in the Monitor Tree hierarchy. For example, in the above screen shot, the Actual Severity value of a Process Server (75) causes the root node, System, to also have a severity of 75. In other words, each parent shows the highest severity value among its children.
Node Types
There are four types of nodes in the Monitor Tree.
- Monitor Node: A node that contains other nodes. You can add Monitor Events to a Monitor Node, but you can't update the node's severity because its severity value is based on the severity of its child nodes.
-
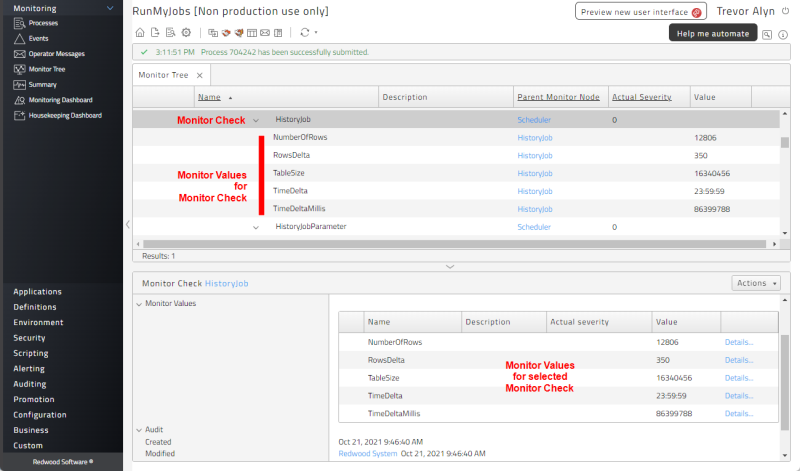
Monitor Value: A node that provides information about an object. For example, the NumberOfRows Monitor Value on each table node returns the number of rows in that table. You can use this number to determine when to raise severity or raise an event. This screen shot shows the five Monitor Values associated with the selected HistoryJob table node.

- Monitor Check: A node that can check for problems and optionally raise its severity and/or send events. For an example of a Monitor Check that uses the NumberOfRows Monitor Value, see Database Monitor Checks.
- Monitor Link: A node that links to another node.
Node Paths
Every node in the monitor tree has a path. In the screen shot above, the path to the selected item is System.Process Server.Queues.REDWOOD.ERP_Queue. The following paths are notable:
- System.Database: Contains all database tables that are specific to RunMyJobs. There are default Monitor Checks that monitor the size of each table. The System_MonitorTables Process Definition stores information about tables that have exceeded their recommended sizes in a process file named
TableGrowth.csv. - System.Queue: Contains all RunMyJobs Queues.
- System.ProcessServer: Contains all Process Servers, Platform Agents, and module-related Process Servers (for example, SAP and JDBC Process Servers).
- System.Cluster: Contains nodes that describe the current application server setup.
Database Monitor Checks
The Database node in the Monitor Tree lets you monitor database tables. You can update the data in this node by submitting the System_MonitorTables Process Definition.
If you expand the node path System.Database.Tables.Sizes.Scheduler, you will see a Monitor Check for each table. If you right-click a table name and choose Edit, you can view and edit the Monitor Check for that table.
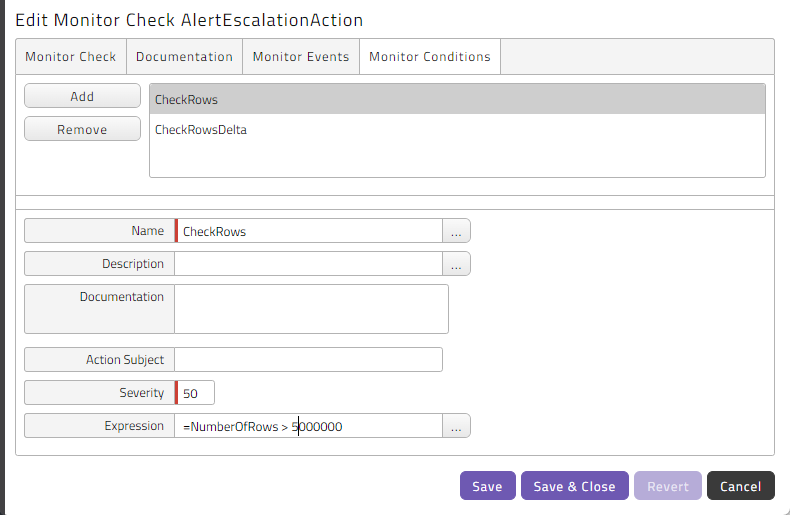
By default, table Monitor Checks have two rules on the Monitor Conditions tab: CheckRows and CheckRowsDelta. By default, the Monitor Condition CheckRows will raise the severity for the table node to 50 if the number of rows exceeds 5,000,000, and CheckRowsDelta will raise the severity for the table node to 75 if RowsDelta exceeds 100,000.

Some tables may grow quickly depending on your use of RunMyJobs. For example, SAP jobs (SAP_AbapRun) usually have many parameters, and this causes the JobParameter table to grow quickly, adding one row for each job/parameter combination. On production systems with many processes and long keep clauses, you might want to increase the CheckRows monitor condition expression to make sure you keep all of the data you need.
Monitor Values for Tables
Tables have the following Monitor Values.
NumberOfRows: The number of rows in the table.TableSize: An estimate of the table size, based on the number of rows the table has.TimeDelta: The amount of time since the previous time the Monitor Check was updated, in hours, minutes, and seconds.TimeDeltaMillis: Same asTimeDelta, but in milliseconds.RowsDelta: The number of rows added/removed since the last update.
Monitor Events
The Monitor Events tab of the Edit Monitor Check pop-up window lets you raise events when the node's severity reaches a particular level. Such events can then schedule processes to alert Operators, restart applications, and so forth.

To set up a Monitor Event, click Add and then select an Event Definition. Then set the Severity field to the threshold above which you want the event to be fired.
To trigger an event only when a monitor's severity number is rising, check the Rising box. If you leave this box unchecked for an event to be raised when a monitor reaches a severity of 50, the event could be raised twice (once when the severity reaches 50 going up, and again when it reaches 50 going down).
Monitor Alert Sources
You can create a monitor alert source on any Monitor Node or Monitor Check.
Process History
By default, process history is kept for 365 days. You can change this value by setting the /configuration/history/jobhistory registry key to the number of days you want, and then submitting the System_Aggregate_History Process Definition.
Note: This affects both the HistoryJob and HistoryJobParameter tables.
Process Server and Queue Monitoring
Process Server and Queue monitoring is disabled by default for performance reasons. To enable it, set the /configuration/jcs/monitoring/enabled registry entry to true. Then, for each Process Server you want to monitor, set the MonitorInterval Process Server parameter.
Process Server Monitor Checks
You specify checks on Platform Agent Process Servers to monitor services, event logs (Windows) or processes and log files (UNIX, HP OpenVMS) as well as sockets (all Platform Agent platforms). These can the be monitored with Events or Monitor Alert Sources to send Operator Messages and/or emails when a monitor has reached a particular severity.
Note: The latter functionality requires the Active Monitoring Module, which requires the Module.Alerting license key.
SAP System Monitors (Deprecated)
If you have connected RunMyJobs to SAP Systems, the default Monitor Tree contains monitors for your SAP Application Servers. To import the bare monitor tree from transaction RZ20, you need to fill in the XAL tab on the SAP System object and import the monitors. To import individual CCMS monitors that you access via transaction RZ20 in SAP GUI, submit the SAP_ImportCcmsMonitors Process Definition.
Context Menu
You can fully expand any node that has children by right-clicking it and choosing Expand All from the context menu.
You can create a new monitor alert source for any Monitor Node or Monitor Check by right-clicking it and choosing New Monitor Alert Source from the context menu.
Note: For generally applicable object context menu options, see Object Context Menu.
Detail View Fields
The following fields display in the Detail View, depending on what kind of node is selected in the Monitor Tree.
| Field | Description |
|---|---|
| Parent Monitor Node | The parent node this monitor belongs to. |
| Name | The unique name of this monitor. |
| Description | The description of the monitor. |
| Documentation | A comment about the monitor. |
| Actual Severity (Node and Check monitors only) | The current severity of the monitor, or -1 if it has not been set before. |
| Remote ID (Node and Check monitors only) | Unique identification of the monitor in the remote system. |
| Linked Monitor (Link monitors only) | The linked monitor (Node or Check monitors). |
| Monitor Events (Node and Check monitors only) | Event to be raised when a monitor reaches a particular severity. |
| Monitor Conditions (Check monitors only) | A monitor condition defines when a problem is raised. |
| Monitor Values (Check monitors only) | A monitor value is a numeric, string or timestamp value used to define monitor conditions. |
| Creation Time | The creation time of this monitor. |
| Time of Last Modification | The last modification time of this monitor. |