Monitor Nodes Screen
The Monitor Nodes screen (Configure > Control > Alerting > Monitor Nodes) provides a comprehensive hierarchical overview of RunMyJobs and lets you monitor potential issues. It displays a hierarchy of expandable nodes, with one row per node.
Note: In the Classic and Legacy UI, this is referred to as the Monitor Tree screen.
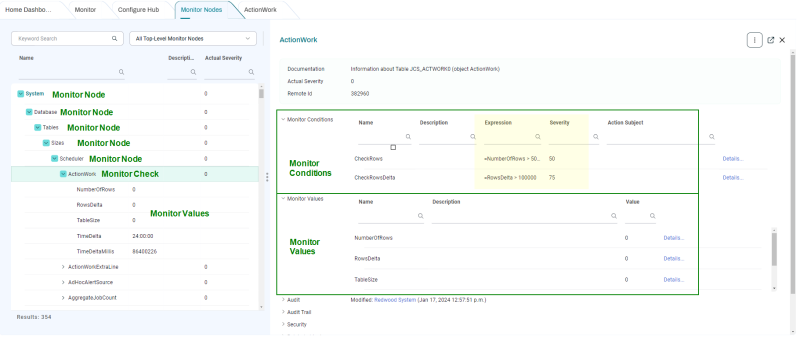
In the following screen shot, the Detail View has been expanded to show more information about the selected node.
Node Types
There are four types of nodes in the Monitor Tree.
- Monitor Node: A node that contains other nodes. You can add Monitor Events to a Monitor Node, but you can't update the node's severity because its severity value is based on the severity of its child nodes.
-
Monitor Value: A node that provides information about an object. For example, the NumberOfRows Monitor Value on each table node returns the number of rows in that table. You can use this number to determine when to raise the severity of the parent nodes or raise an Event. The screen shot above shows the five Monitor Values associated with the selected ActionWork table node. You can use Monitor Values in Monitor Conditions.
- Monitor Check: A node in the node tree that can check for problems with a particular thing, and optionally raise its severity and/or send Events. For an example of a Monitor Check that uses the NumberOfRows Monitor Value, see Database Monitor Checks.
- Monitor Link: A node that links to another node.
Tip: You can fully expand any node that has children by right-clicking it and choosing Expand All from the context menu.
Monitor Conditions
A Monitor Condition is the part of a Monitor Check that determines its severity (see below). The screen shot above shows two Monitor Conditions:
-
CheckRows: This Monitor Condition runs the associated REL Expression to get a
trueorfalsevalue. If the value istrue, it sets the Monitor Check's Severity to 50. -
CheckRowsDelta: This Monitor Condition runs the associated REL Expression to get a
trueorfalsevalue. If the value istrue, it sets the Monitor Check's Severity to 75.
If both Monitor Conditions evaluate to true, the highest severity between them is assigned to the Monitor Check.
| Field | Description | Example Value |
|---|---|---|
| Name | A name for the Monitor Check. | CPUsageGood
|
| Description | If set, this value is displayed instead of the name. | Normal CPU usage
|
| Expression | A REL expression to evaluate severity. | =CPUBusy > 50
|
| Severity | The actual severity you want to map the REL expression to. | 25
|
| Action Subject | The user under which the Monitor Check should be performed. |
|
Note: For information on creating your own custom Monitor Conditons, see Creating Custom Monitor Conditions.
Severity
The severity of any potential issues is indicated by a value in the Actual Severity column. Severity is indicated by a number from 0-100, with lower numbers being less severe than higher numbers.
Severity can also be indicated by a dot in the middle column. You can hover over each dot to see a severity number.
-
No dot: Severity of 24 or less. Ideally, there should be no monitor nodes with a severity above 24.
-
Green dot: Severity between 25 and 49.
-
Yellow dot: Severity between 50 and 74.
-
Red dot: Severity of 75 or greater.
Severity values propagate upward in the Monitor Nodes hierarchy. For example, if a Job Server has an Actual Severity value of 75, the root node, System, also has a severity of 75. In other words, each parent node shows the highest severity value among its child nodes.
Note: By default, only database tables are monitored. For information about other monitoring options, see Job Server and Queue Monitoring.
Node Paths
Every node in the monitor tree has a path. In the screen shot above, the path to the selected item is System.Database.Tables.Sizes.Scheduler.HistoryJob. The following paths are notable:
- System.Database: Contains all database tables that are specific to RunMyJobs. There are default Monitor Checks that monitor the size of each table. The System_MonitorTables Job Definition stores information about tables that have exceeded their recommended sizes in a process file named
TableGrowth.csv. - System.Queue: Contains all RunMyJobs Queues.
- System.ProcessServer: Contains all Job Servers, Platform Agents, and module-related Job Servers (for example, SAP and JDBC Job Servers).
- System.Cluster: Contains nodes that describe the current application server setup.
Detail View Fields
The following fields display in the Detail View, depending on what kind of node is selected.
| Field | Description |
|---|---|
| Parent Monitor Node | The parent node this node belongs to. |
| Name | The unique name of this node. |
| Description | The description of the node. |
| Documentation | A comment about the node. |
| Actual Severity (Monitor nodes and Monitor Check nodes only) | The current severity of the node, or -1 if it has not been set before. |
| Remote ID (Monitor nodes and Monitor Check nodes only) | Unique identification of the node in the remote system. |
| Linked Monitor (Link monitor nodes only) | The linked monitor node (Monitor Nodes and Monitor Check nodes only). |
| Monitor Events (Monitor nodes and Monitor Check nodes only) | Event to be raised when a node reaches a particular severity. |
| Monitor Conditions (Monitor Check nodes only) | Lets you specify Monitor Conditions for a Monitor Check. |
| Monitor Values (Monitor Check nodes only) | Lets you specify Monitor Values for a Monitor Check. |
| Creation Time | The creation time of this node. |
| Time of Last Modification | The last modification time of this node. |