Customizing the Housekeeping Dashboard
You can control various aspects of the monitors on the Housekeeping Dashboard by clicking  at the upper right. This button lets you choose Global configuration, User configuration, or Help.
Global Configuration
The Global configuration screen lets you control the thresholds for the various graphs that make up the Housekeeping Dashboard. In this screen, the graph configurations are grouped into Housekeeping Health Configuration, Housekeeping Processes Configuration, and Retention Settings.
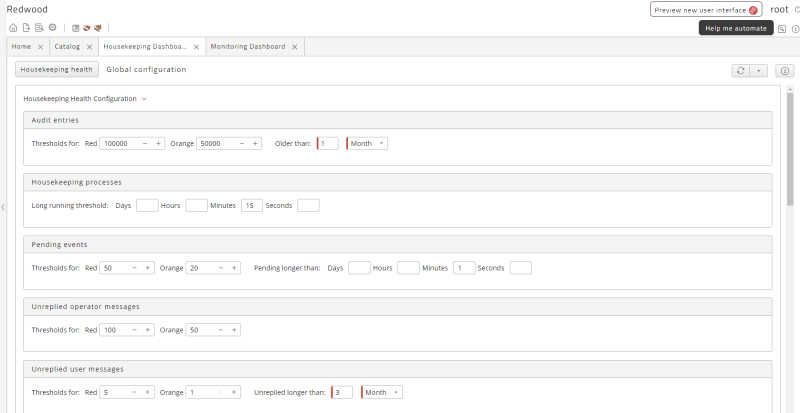
Housekeeping Health Configuration
In this group, you can set each graph's thresholds for turning Red and Orange. Some graphs let you further control their functionality by specifying how long a process has been in a given state.
Housekeeping Process Configuration
The Housekeeping Process Configuration group lets you configure the display of housekeeping processes. You can control which processes are active, which processes display, how frequently they are updated, and what time range to show information for.
Retention Settings
RunMyJobs displays a warning in the top bar if it surpasses its retention limits.

The default limits are:
- 100,000 processes.
- 10,000 new processes over a period of 24 hours.
- 80% of processes without a specific keep clause.
You can customize these settings with the controls in the Retention Settings group.
-
Count: Lets you set the number of table rows that triggers a retention warning.
-
Delta: Lets you control the number of table rows that can be added daily without triggering a retention warning.
-
Ratio: The ratio (as a percentage) of Process Definitions with retention defined vs. Process Definitions without retention defined.
User Configuration
The User configuration screen lets you control which graphs display for you. You can drag and drop graphs between the Available and Selected columns.