Monitor Screen
Job calls and Workflow calls that have been submitted create records that are generally referred to as Processes. You can view Processes for scheduled and completed Jobs and Workflows in the Monitor screen.
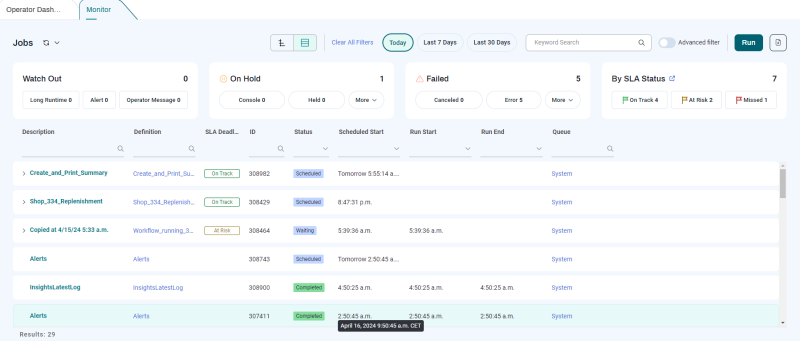
The Monitor screen provides a central overview of all Processes and their statuses, on all managed servers, in any Queue. You can monitor Processes as they execute and perform a number of actions on them.
For Workflow calls, the Monitor screen displays a number of properties in customizable columns, to give you an up-to-date overview of the Processes and their states. You can also click a Workflow call to view it in interactive Runtime View -- even while it is running.
This screen includes the following sections.
-
The top part of the screen provides an at-a-glance overview of Process states.
-
The
 switch lets you switch between Gantt Chart view and Table View (shown above).
 -
Dedicated buttons let you quickly focus in on Processes from Today, the Last 7 Days, and the Last 30 Days.
-
The Keyword Search field lets you search for Processes by name (if you enter letters) or ID (if you enter numbers).
-
The Advanced filter switch hides the date switches and the tiles at the top and displays a dropdown list that lets you choose from a variety of Process filters.
-
The Run button displays the Run JobOverlay, which lets you run a Job or Workflow directly from the Monitor screen.
-
The
 button lets you export the data currently shown in CSV format.
The Watch Out tile lets you filter Processes by:
-
Processes in Running states: PreRunning, Waiting, Running, PostRunning, and Uncertain.
-
Processes with Alerts.
-
Processes with Operator Messages.
-
-
The On Hold tile lets you filter Processes by on-hold Process states. The first two options have dedicated buttons, and the rest are available from the More dropdown list.
-
The Failed tile lets you filter Processes by failed Processstates. The first two options have dedicated buttons, and the rest are available from the More dropdown list.
-
The By SLA Statustile lets you easily show which SLA Processes are On Track, At Risk, or Missed. There’s also a link for quickly opening the SLA Dashboard screen.
-
A Clear All Filters button displays at the top when you have one or more filtering methods selected.
-
The refresh
 button and dropdown list lets you manually refresh the screen, or choose to have it refresh automatically at various intervals.
-
-
The main part of the screen displays Processes in rows. You can expand Workflow calls to display their Steps and Job calls.
-
The Detail View displays details about the Process selected in the top view, and includes an Actions button that lets you perform actions specific to the selected Process.
Note: For information about the columns in the Process list, see Monitor Columns.
Note: For information about the context menu for Processes, see Monitor Context Menu.
Note: Changes to Submit Frame recurrences affect all Processes that have not reached the status Running.
Tip: If you want control over which Submit Frame recurrences are affected, put all of the recurring Process executions on Hold to make sure you have enough time to perform the change. Remember to release them when you're done.