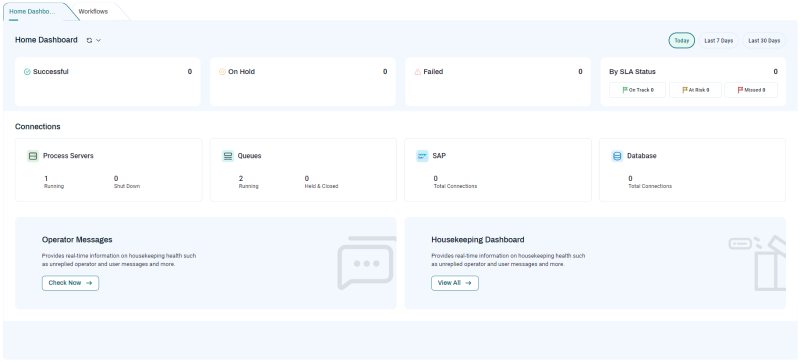
Home Dashboard Screen
The Home Dashboard screen lets you monitor the health of your system. Each card on this screen provides an overview of its subject. Click a card to view a more detailed overview of the items it represents.
To navigate to the Home Dashboard screen, click Dashboard in the Navigation Bar.
The buttons at the top right let you specify the time range for the data to be displayed. The options are:
-
Last 30 Days: The past thirty days.
-
Last 7 Days: The previous week, starting at midnight Sunday.
-
Today: Since midnight today.
-
Custom date range.
The cards on this screen are as follows.
-
Successful: Indicates how many Job calls ran successfully in the selected time range.
-
On Hold: Indicates how many Job calls currently have their execution stopped.
-
Failed: Indicates how many Job calls have failed in the selected time range.
-
By SLA Status: Indicates how many Job calls currently have an SLA status of On Track, At Risk, and Missed.
-
Process Servers: Indicates how many Process Servers currently have statuses of Running or Shut Down.
-
Queues: Indicates how many Queues currently have a status of Running, and how many have a status of Held or Closed.
-
SAP: Indicates how many SAP connections currently exist.
-
Database: Indicates how many total database connections currently exist.
-
Operator Messages: Prompts you to check for Operator Messages and their associated alerts.
-
Housekeeping Dashboard: Reminds you to check your Housekeeping Dashboard screen frequently. For more information, see Housekeeping Best Practices.
Tip: If you hover over the name of most tiles, an  icon displays. Click this icon to view more details in the Monitor screen.